Skip to content
Enslavement and Gunpowder after British Abolition.
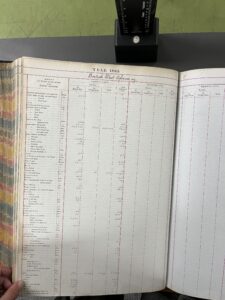
One of the things I wanted to do during my research was see what happened with gunpowder imports after the British abolition of the slave trade. Radburn’s research definitively established the relationship between gunpowder and the slave trade, but his research was mostly devoted to the eighteenth century. Here I offer an admittedly incomplete picture. Column “B” on enslaved people relies on the Slave Trade database. Column “C” contains data on pounds of gunpowder imported. Note the totals: 2.8 million people and 32 million pounds of gunpowder. Again, column “B” is partial; I will provide updates. Finally, I have provided a photograph from 1865; this relates to only “British West Africa.” Interestingly, in contrast to eighteenth century records, this document also lists arms.

| 1807 |
92,975 |
695,924 |
|
| 1808 |
37,716 |
217,390 |
|
| 1809 |
33,958 |
|
|
| 1810 |
62,385 |
|
|
| 1811 |
56,883 |
|
|
| 1812 |
64,506 |
|
|
| 1813 |
50,749 |
|
|
| 1814 |
54,565 |
85,500 |
|
| 1815 |
59,255 |
82,750 |
|
| 1816 |
80,806 |
99,400 |
|
| 1817 |
98,669 |
371,350 |
|
| 1818 |
93,368 |
468,675 |
|
| 1819 |
75,169 |
417,050 |
|
| 1820 |
84,073 |
353,150 |
|
| 1821 |
66,108 |
757,900 |
|
| 1822 |
78,503 |
1,000,225 |
|
| 1823 |
44,955 |
745,770 |
|
| 1824 |
56,284 |
807,550 |
|
| 1825 |
74,333 |
1,122,500 |
|
| 1826 |
84,042 |
839,175 |
|
| 1827 |
79,579 |
1,471,800 |
|
| 1828 |
84,291 |
|
|
| 1829 |
108,304 |
|
|
| 1830 |
79,102 |
|
|
| 1831 |
24,159 |
|
|
| 1832 |
19,760 |
2946956 |
|
| 1833 |
20,272 |
|
|
| 1834 |
29,601 |
|
|
| 1835 |
44,564 |
|
|
| 1836 |
58,296 |
|
|
| 1837 |
77,269 |
2717929 |
|
| 1838 |
82,530 |
|
|
| 1839 |
90,198 |
|
|
| 1840 |
63,308 |
|
|
| 1841 |
47,528 |
|
|
| 1842 |
37,755 |
2698721 |
|
| 1843 |
35,801 |
|
|
| 1844 |
42,621 |
|
|
| 1845 |
32,920 |
|
|
| 1846 |
20,628 |
|
|
| 1847 |
30,183 |
2590892 |
|
| 1848 |
54,744 |
|
|
| 1849 |
76,657 |
3685062 |
|
| 1850 |
41,617 |
3905160 |
|
| 1851 |
17,614 |
|
|
| 1852 |
10,167 |
|
|
| 1853 |
17,268 |
|
|
| 1854 |
13,533 |
|
|
| 1855 |
6,203 |
|
|
| 1856 |
8,436 |
|
|
| 1857 |
15,428 |
|
|
| 1858 |
17,707 |
|
|
| 1859 |
33,814 |
|
|
| 1860 |
27,442 |
|
|
| 1861 |
24,898 |
|
|
| 1862 |
14,413 |
|
|
| 1863 |
7,736 |
|
|
| 1864 |
4,517 |
|
|
| 1865 |
2,197 |
4010099 |
|
| 1866 |
851 |
|
|
| |
2,853,213 |
32,090,928 |
|
| |
|
|
|
| |
|
|
|
| |
|
|
|
| |
|
|
|