 Skip to content
Settler Colonialism and CO2
One of the topics I did not explore in much detail in The Killing Age is land-use—specifically deforestation—and CO2 emissions in the USA. American settlers cut vast amounts of timber, for lumber, fuel, or simply burned to open land up for agriculture across a country that in many areas was densely forested.
I have been mucking about in the PRIMAP database as an experiment, as well as other sources. Please note this is an experiment; I have not proofed anything or checked against other additional data. I should also imagine that getting to an accurate estimation is basically impossible. What I offer here is illustrative only. The general point is simply that the expansion of settlement resulted in large emissions of CO2. Deforestation tracked settlement, especially though not only east of the Mississippi River. As I mention in The Killing Age, the introduction of steam ships especially on the Mississippi River also contributed to deforestation.
Great Britain already has destroyed many of their forests, so emissions from this source is unlikely to be significant for this period. Add land-use to the other sources, however, changes the picture of total CO2 emissions for the USA and UK, indeed dramatically.
Determining deforestation is challenging. The 1860 US census (Table No. 1) indicated a total of 163,110,720 acres of improved land…that is land cleared and/or turned to agriculture. The USDA (FS-1035, August 2014) noted that in the USA c. 1630 there were just over 1 million acres of forest land; since then 256 million acres were turned mostly into farms. According to this report, total forest land has been stable since about 1910, which is a good thing since trees function as a carbon sink. Large parts of the country remain forested with second (or more) growth trees; in some areas there are more trees than ever, which means that the story is, like all history, complicated. Today, forest products generate hundreds of billions of dollars annually.
The density of these lands (number of trees, species, age, etc.) is exceptionally difficult to estimate with much precision. A back-of-the-envelope estimate of trees removed ranges anywhere from 3-14 billion trees between 1700-1865, an extraordinarily wide range. However, even if we take the most conservative estimate, it seems safe to say that deforestation went together with settler colonialism. This should not be surprising.
Another study from 1999 (R.A. Houghton et al, “The U.S. Carbon Budget: Contributions from Land-Use Change,” Science, v. 285, 5427, 23 Jul. 1999, estimated 27 petagrams [basically 27 gigatons] of carbon between 1700-1945, give or take 6 petagrams. Here is an extended quote from this study:
“According to our analysis, changes in land use released about 25 Pg C to the atmosphere over the period 1700-1990, largely from the conversion of forests to agricultural lands and from cultivation of prairie soils (Fig. 1). The net release, overall, included a net uptake of 2.4 Pg C after 1945 as both the area and biomass of forests increased in response to fire suppression, reduced harvest of fuel wood, and the abandonment of farms. It also included an uptake in eastern forests, largely offset by releases of carbon from western regions where rates of industrial wood harvest increased.
The net flux resulted from accumulations of carbon in regrowing vegetation and, to a lesser extent, soils and from releases of carbon from burning and decay (Fig. 2). Before European settlement, fires accounted for the largest sources (immediate burning and delayed decay) and sinks of carbon, although the net flux from fire was nearly zero as long as rates of burning were about constant. As wood harvest and agricultural clearing increased in the 18th century, emissions from fire, soil, and wood products increased, but annual accumulations also increased as the areas of forests recovering from fire and harvesting increased. Replacement of wood fuels with fossil fuels midway through the 19th century began to reduce the emissions from fuel wood harvesting, and fire suppression after 1930 further reduced the areas burned. Despite the recovery of forests in the east, increasing rates of industrial wood harvests in the west and south increased the generation of slash and wood products and hence emissions of carbon. The largest annual accumulations of carbon occurred in the 1950s and 1960s. By the 1970s, as a result of aging (slower growing) forests and a resurgence of fuel wood use, the net flux from land-use change was close to zero.
The errors resulting from uncertainties in rates of land-use change, from aggregated estimates of biomass, growth, and decay, and from simplifying assumptions in the structure of the model may be estimated by comparing the results of successive analyses (Fig. 3). For the three analyses in which changes in land use are reasonably well documented, estimates of the long-term (1700-1990) carbon flux range between 24 and 30 Pg C. For shorter intervals, the errors are larger. The difference between our estimate that includes fire and an earlier estimate for North America that did not include fire (18) is as large as 0.2 Pg C [year.sub.-1] before 1900. A comparison of our estimates with and without fire shows that including fire and fire suppression changed estimates of flux by as much as 0.05 Pg C [year.sub.-1]. Surprisingly, fire reduced the estimated emissions during the 1800s. The reduction occurred because the biomass of forests cleared for agriculture was less if fire was included in the analysis. The errors are estimated to be less than [+ or -] 0.1 Pg C [year.sup.-1] in recent decades (20). The analysis that shows a large sink for carbon beginning in 1920 is based on generous assumptions about woody encroachment (21) and early fire exclusion (22). Although detailed site-specific data document these processes, the aerial extent and the historical pattern of the changes are unknown. The curve represents an upper limit for the sink strength of U.S. ecosystems.”
(Note the above refers to carbon, not CO2. Carbon has a molecular weight of 12.01 g/mol. CO2 has a molecular weight of 44.01 g/mol. So, 1 gigaton of C=3.67 gigatons of CO2. 27 gigatons of carbon=99.09 gigatons of CO2.)
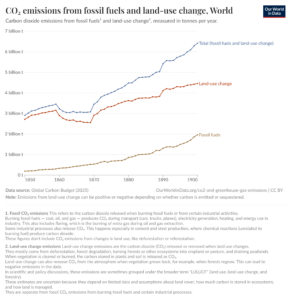
Here are some line graphs that help demonstrate some of the issues. Again, this is an experiment; the points I want to make are the role of settlement and how two countries accounted for so much of total emissions. We tend to point our fingers at the UK and the Industrial Revolution when discussing CO2. But when we add the history of land use in the USA the overall picture changes markedly.
Again, all this is preliminary and experimental. Please do not reproduce without permission.
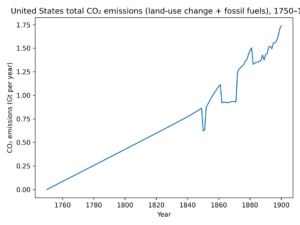
USA Yearly CO2 Emissions (Land-use and Fossil Fuels), 1750-1900
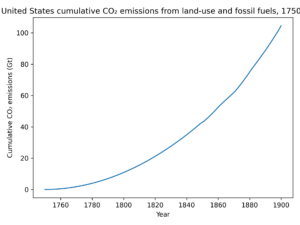
USA Cumulative CO2 Emissions (Land-use and Fossil Fuels), 1750-1900
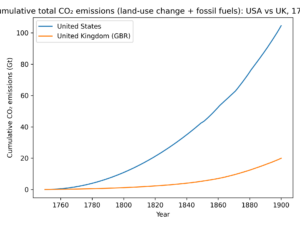
Cumulative Total CO2 Emissions (Land-use and Fossil Fuels)
USA and UK, 1750-1900
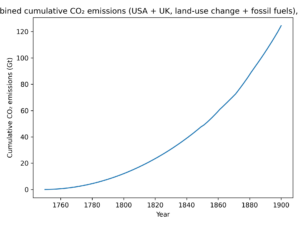
Combined Cumulative CO2 Emissions
USA and UK, 1750-1900
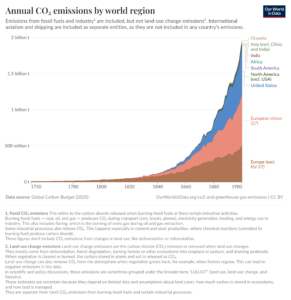
A back-of-the-envelope calculation is that the USA represents about 35% of global land use CO2 in the period 1850-1900. The OWID database does not go back before 1850. When one adds the UK and total CO2 emissions, on a per capita basis (not including slaves and Indians in the USA), people in these countries emitted 20 times more than the rest of the world.
Again, these data present considerable challenges. I use them, and you should too, to offer general trends.
Sources: OWID; PRIMAP-hist national historical emissions time series v.2.7; Gutschow et al 2016; Global Carbon Budget. You can access the last at: https://essd.copernicus.org/articles/17/965/2025/. Note again how 1850 is so often used as a beginning date; this creates a host of problems.